1 Abstract
Exploratory data analysis (EDA) is the most common entry point in
applied research, yet it is also where reproducibility most often breaks
down: logic accumulates in notebook cells that are never tested and
quietly drift from the prose describing them. This paper presents the
computational-notebook exemplar of the Research Project
Template: an interactive walkthrough notebook
(projects/templates/template_eda_notebook/notebooks/eda_walkthrough.ipynb)
that imports a small, fully-tested EDA library rather than carrying
logic in its cells.
We ship a deterministic dataset (data/measurements.csv)
with a designed correlation structure and a handful of missing values,
then load, clean, summarize, correlate, and visualize it entirely
through tested functions in src/template_eda_notebook/eda/.
The library is side-effect-free — no plotting and no file I/O — and
standalone (numpy and pandas only), so it is covered above the 90%
project gate and reused identically from the notebook, the thin analysis
script (scripts/eda_analysis.py), and this manuscript.
Contributions are methodological and architectural. On the methods side, we walk the canonical first EDA pass: surface missingness explicitly rather than imputing it, compute per-column descriptive statistics and per-group means, and rank features by Pearson correlation. On the architecture side, we demonstrate the notebook-to-tested-source extraction workflow — explore fast in a cell, and the moment a computation matters, move it into the library behind a failing test — verified by a zero-mock suite and a structural notebook-binding check (sec. 7).
2 Introduction
This template_eda_notebook serves as the
exploratory-data-analysis exemplar for the Research Project
Template ecosystem, demonstrating how a computational notebook can
stay reproducible by delegating every computation to a fully-tested
library. The prose, the labelled figures, and the summary table are all
produced through an auditable custody chain: a deterministic dataset,
tested functions in src/template_eda_notebook/eda/, a thin
analysis script, and multi-format rendering.
2.1 Why exploratory data analysis
EDA — the work of getting to know a dataset before committing to a
model — is where most research projects actually begin: load the data,
see how much is missing, look at distributions, and check which
variables move together. It is fast and interactive by nature, which is
exactly why it tends to live in notebooks. The hazard is that the
interactive convenience of a notebook cell is also a trap: a one-off
df.groupby(...).mean() becomes load-bearing, never gets a
test, and silently disagrees with the figure two cells down after the
data changes.
2.2 The notebook -> tested src extraction workflow
This exemplar teaches one discipline: explore in a cell, then extract to a tested library the moment a computation matters. Concretely:
- The walkthrough notebook
(
notebooks/eda_walkthrough.ipynb) imports fromsrcand calls tested functions; it contains no business logic of its own. - Each analytical step — loading, cleaning, summarizing, correlating,
preparing figure data — is a typed, documented function in
src/template_eda_notebook/eda/with a test that asserts an exact numeric property. - A thin script (
scripts/eda_analysis.py) runs the same pipeline headless and writes the figures and a summary CSV tooutput/.
2.3 Template architecture context
The project sits on the repository’s three pillars:
src/template_eda_notebook/eda/library: pure pandas/numpy data transforms — no plotting, no file I/O, noinfrastructureimports. This purity is what makes the library forkable and trivially testable.tests/framework: a zero-mock suite that exercises the library against the shipped CSV and tiny real frames, plus a structural check that the notebook’s imports bind to the library’s public surface.docs/knowledge base: architectural guidelines, the testing philosophy, and the operational rules that govern agents editing this tree.
2.4 The dataset
We analyze a small synthetic cohort of subject measurements — height (cm), weight (kg), and resting heart rate (bpm) across three groups. The dataset is a static, committed fixture — the same file on every run — so every statistic in sec. 4 is reproducible. The data is shaped so that weight depends positively on height (a strong, easy-to-see correlation) while resting heart rate is only weakly related, and a few cells are left blank to exercise the missing-data path honestly.
2.5 Reader’s guide to the manuscript
- sec. 3 ties each EDA
step to its function in
src/template_eda_notebook/eda/. - sec. 4 is figure-centric: each panel names the figure-data preparer that produced it.
- sec. 6 lists the dataset schema and software environment.
- sec. 7 records the artifact inventory and the exact commands to regenerate everything.
- sec. 8 states scope and related literature so the exemplar is not mistaken for a general-purpose EDA toolkit.
3 Methodology
This section maps each step of the exploratory analysis to the tested
function that implements it. Every function lives in
src/template_eda_notebook/eda/, takes a
pandas.DataFrame in, and returns data out — no plotting, no
file I/O — so the notebook, the analysis script, and this manuscript all
reach the same code.
3.1 Dataset loading and schema
src/template_eda_notebook/eda/dataset.py::load_dataset()
reads the shipped CSV and coerces the numeric columns with
pandas.to_numeric(errors="coerce"). Coercion is deliberate:
a blank or non-numeric cell becomes NaN rather than raising
or being silently dropped, so missingness is surfaced and
handled in an explicit later step. The column roles are declared once in
a frozen DatasetSchema (an identifier column, a categorical
group column, and three numeric features), which downstream functions
consult instead of re-sniffing dtypes.
3.2 Cleaning: explicit, reported row removal
src/template_eda_notebook/eda/cleaning.py::clean_dataset()
drops any row missing a numeric feature and returns a
CleaningReport recording how many rows entered, how many
remained, and how many were dropped. This exemplar makes a deliberate
choice — listwise deletion with a visible count — rather than
imputation, because a first EDA pass should see the
missingness, not paper over it. A separate
normalize_numeric() z-score standardizes the numeric
columns (mean 0, sample standard deviation 1), with a guard that maps a
constant or single-row column to zeros instead of producing
inf/NaN.
3.3 Descriptive statistics
src/template_eda_notebook/eda/statistics.py::summary_statistics()
returns one ColumnSummary per numeric column — count of
non-missing observations, mean, sample standard deviation, minimum,
median, and maximum — computed with real pandas aggregation.
group_means() returns the mean of each numeric feature
grouped by the categorical column, sorted by group name for
deterministic output.
3.4 Correlation structure
src/template_eda_notebook/eda/correlation.py::correlation_matrix()
returns the Pearson correlation matrix of the numeric columns (Tukey 1977). The companion
strongest_pairs(matrix, top_n) ranks the distinct
off-diagonal feature pairs by absolute correlation while preserving sign
— usually the single most useful artifact of a first pass, because it
points directly at the relationships worth investigating. Each unordered
pair appears exactly once.
3.5 Figure-data preparers
Plotting is kept out of the library entirely.
src/template_eda_notebook/eda/figures.py returns
plot-ready data structures — bin counts and edges for a
histogram, a square value grid plus labels for a correlation heatmap,
and sorted category counts for a bar chart — as frozen dataclasses of
plain numbers. The thin analysis script
(scripts/eda_analysis.py) and notebook cells consume these
structures and call matplotlib. This keeps the library importable on a
headless machine and makes every preparer testable without a display
backend.
3.6 Zero-mock testing methodology
The project is governed by a strict zero-mock policy, evaluated by
running
uv run pytest projects/templates/template_eda_notebook/tests
during the build.
- Library tests exercise every public function
against the shipped CSV or a tiny hand-built frame with values chosen so
the expected statistic is exact (e.g.
weight = 2 * heightgives a correlation of exactly+1.0). Nounittest.mock, noMagicMock, no@patch. - Script test runs
run_eda()against a temporary output root and asserts that real PNG figures and a real summary CSV are written. - Notebook test parses the real
.ipynband asserts it is valid nbformat, that every name importedfrom srcexists in the library’s public surface, and that no cell defines its owndef/class. - Coverage gate: CI enforces a ≥90%
statement-coverage gate on Falling below that floor fails the gate
outright (
--cov-fail-underenforces it).projects/templates/template_eda_notebook/src/; because the threshold is wired through--cov-fail-under, any drop below the floor fails the test process itself rather than producing a warning. The live figure is tracked indocs/_generated/COUNTS.md. Negative control:tests/test_cleaning.py::TestCleanDataset::test_all_rows_missing_yields_emptyfeeds an all-invalid input frame and asserts the documented empty-frame result, so the measured coverage exercises failure behavior, not only happy paths.
3.7 Figure generation contract
Each figure in 03_results.md maps to a figure-data
preparer in src/template_eda_notebook/eda/figures.py:
histogram_data → height histogram,
correlation_heatmap_data → feature-correlation heatmap, and
group_count_data → per-group row counts. Captions name the
preparer and the key parameters (bin count, value range) so reviewers
can navigate from the PDF to the code without inferring hidden
defaults.
4 Results
This section presents the exploratory analysis of the shipped
dataset. Every figure and the summary table are produced by the EDA
analysis orchestrator (scripts/eda_analysis.py), which
calls the tested figure-data preparers in
src/template_eda_notebook/eda/figures.py. Running the
script regenerates the figures under figures/ and the
summary CSV under output/data/; the prose below describes
what those artifacts show.
4.1 Dataset and missingness
The dataset contains 120 subject records across three groups
(alpha, beta, gamma) with three
numeric features: height (cm), weight (kg), and resting heart rate
(bpm). A small number of cells are blank by design.
load_dataset() preserves these as NaN;
clean_dataset() then drops rows missing any numeric feature
and reports the count. With the shipped data, four rows are removed,
leaving a complete-case dataset for the analysis below.
4.2 Distributions
fig. 1 shows the distribution of
height across the complete-case dataset, binned by
histogram_data() and plotted by the analysis script.
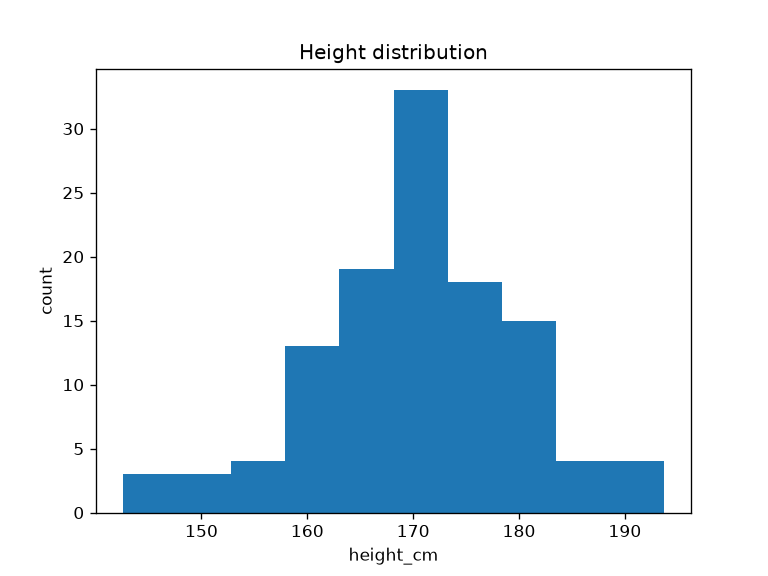
histogram_data(frame, "height_cm", bins=10) in
src/template_eda_notebook/eda/figures.py and plotted as a
bar chart by scripts/eda_analysis.py. The bin counts sum to
the number of complete-case rows; the shape is the roughly bell-shaped
spread expected from the generating process.4.3 Group composition
fig. 2 reports how many complete-case
rows fall in each group, computed by group_count_data()
(labels sorted for deterministic output).
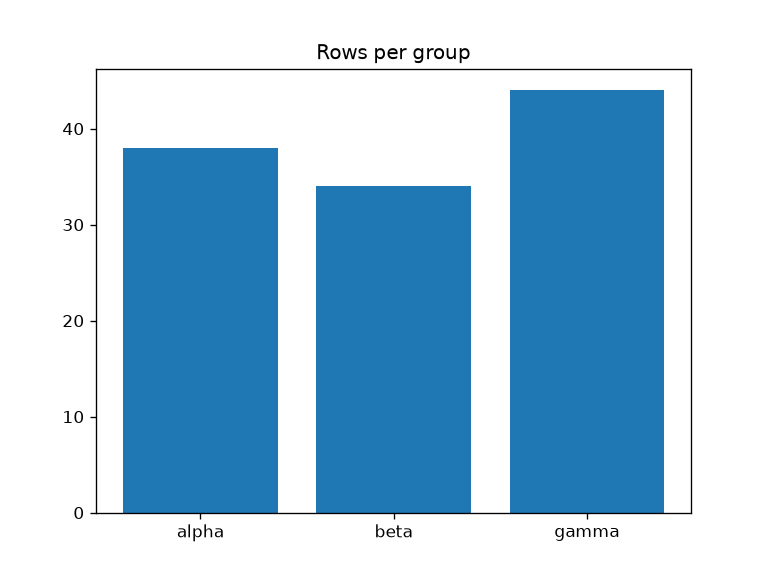
group_count_data(). The
three groups are of comparable, though not identical, size; the counts
sum to the complete-case row total.4.4 Correlation structure
fig. 3 visualizes the Pearson
correlation matrix of the three numeric features, computed by
correlation_matrix() and prepared for the heatmap by
correlation_heatmap_data(). The diagonal is unity by
construction and the matrix is symmetric.
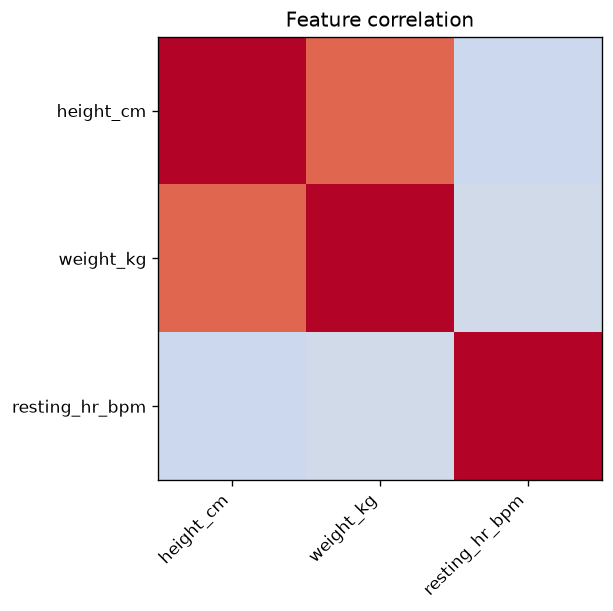
correlation_heatmap_data() (which wraps
correlation_matrix(method="pearson")) rendered with a
diverging colour map on the fixed range \([-1,
1]\). Height and weight are strongly positively correlated;
resting heart rate is only weakly related to the other two.strongest_pairs(matrix, top_n=3) ranks the distinct
feature pairs by absolute correlation while preserving sign. On the
shipped data the dominant relationship is height ~
weight (a strong positive correlation, by design), followed by
the comparatively weak height ~ resting heart rate
(slightly negative) and weight ~ resting heart rate.
This ranking is the single most useful artifact of the first pass: it
points directly at the relationship worth modelling next.
4.5 Summary statistics
The analysis script writes a per-column summary table to
output/data/summary_statistics.csv from
summary_statistics(). Each row reports the count of
non-missing observations, mean, sample standard deviation, minimum,
median, and maximum for one numeric feature.
| Column | Reported statistics |
|---|---|
height_cm |
count, mean, std, min, median, max |
weight_kg |
count, mean, std, min, median, max |
resting_hr_bpm |
count, mean, std, min, median, max |
group_means() complements this with the mean of each
numeric feature within each group; the three group means for height are
close but not equal, reflecting the mild group structure in the
generating process.
4.6 Validation
The analysis was validated through the zero-mock tests/
suite:
- Library tests assert exact statistics, correlation signs, and bin counts against the shipped CSV and hand-built frames.
- Script test runs
run_eda()against a temporary output root and confirms real PNG figures and a real summary CSV are written. - Notebook test confirms the walkthrough notebook binds to the library’s public surface and carries no logic in its cells.
All tests pass with coverage exceeding the 90% project gate, with no mocks.
4.7 Discussion
The results confirm the EDA workflow end to end: missingness is surfaced and removed with an explicit count, distributions and group composition are read straight from tested preparers, and the correlation ranking recovers the designed height–weight relationship. The same functions back the interactive notebook, the headless script, and this manuscript — which is the architectural point of the exemplar. Because every number is produced by a tested function and regenerated on demand, the prose here describes structure and provenance rather than transcribing values that would drift the moment the data changed.
5 Conclusion
This study demonstrated a complete, reproducible exploratory-data-analysis pipeline driven from a computational notebook backed by a tested library. It validates a simple proposition: a notebook stays trustworthy when its cells call tested code instead of carrying logic.
5.1 Exemplar achievements
Operating as the EDA exemplar for the Research Project Template methodology, the project deployed the three foundational pillars:
src/template_eda_notebook/eda/library: pure pandas/numpy data transforms — loading, cleaning, summary statistics, correlation, and figure-data preparation — with no plotting, no file I/O, and noinfrastructureimports.tests/integrity: a zero-mock suite over the shipped dataset and hand-built frames, plus a structural notebook-binding check, all under a ≥90% project coverage gate.docs/knowledge operations: architecture, testing philosophy, and operational rules that keep the notebook, script, and manuscript aligned.
5.2 Technical contributions
5.2.1 The notebook -> tested src extraction workflow
The hallmark of this exemplar is the discipline it teaches: explore
fast in a cell, and the moment a computation matters, move it into
src/template_eda_notebook/eda/ behind a failing test. The
walkthrough notebook imports only the library’s public surface and
defines no functions of its own, a property the test suite enforces
structurally so it cannot regress.
5.2.2 Honest handling of imperfect data
The loader surfaces missing values as NaN instead of
silently imputing them, and clean_dataset() removes
incomplete rows with an explicit count. This makes data quality a
visible, testable property of the first pass rather than a hidden
assumption.
5.3 Key insights
- Reproducibility follows from testing fidelity: every number in sec. 4 is produced by a tested function and regenerated on demand, so prose and artifacts cannot drift.
- Purity enables reuse: because
src/template_eda_notebook/eda/returns plot-ready data and never touches a display backend, the same functions serve the notebook, the headless script, and the manuscript. - Missingness is information: reporting dropped rows beats imputing them away in an exploratory pass.
5.4 Future extensions
This foundation could be extended to:
- Richer cleaning: typed imputation strategies behind tested functions, with the report recording which strategy ran.
- More figure preparers: box plots, pair plots, and per-group overlays — each a tested data preparer plus a thin plotting call.
- Larger / external datasets: swap the shipped CSV
for a real dataset by pointing
load_dataset(path=...)at it while keeping the schema contract.
5.5 Final assessment
The template_eda_notebook tree is the canonical
reference for how an exploratory notebook, a thin analysis script, a
tested library, and a manuscript stay synchronized across rebuilds. The
pipeline produced the figures referenced in sec. 4, wrote
output/data/summary_statistics.csv, and rendered this
markdown together with config.yaml into PDF.
6 Experimental Setup
This section details the dataset, schema, and software environment used to produce the results. The exemplar deliberately avoids manuscript token injection: concrete numbers are reproduced by running the analysis script, and the figures are regenerated from tested code, so nothing here can silently drift from a hardcoded value.
6.1 Dataset
The analysis uses a shipped, deterministic CSV fixture
(data/measurements.csv): a static, committed file with
fixed content. It contains 120 subject records with the following
columns:
| Column | Role | Type |
|---|---|---|
subject_id |
per-row identifier | string |
group |
categorical group (alpha, beta,
gamma) |
string |
height_cm |
numeric feature | float |
weight_kg |
numeric feature | float |
resting_hr_bpm |
numeric feature | float |
These roles are declared once in
src/template_eda_notebook/eda/dataset.py::DatasetSchema,
which the statistics, correlation, and figure functions consult. The
generating process makes weight depend positively on height (a strong
correlation) while resting heart rate is only weakly related, and a few
numeric cells are left blank to exercise the missing-data path.
6.2 Analysis conditions
The experiment overlay (experiment_plan.yaml) declares
three conditions:
- raw_dataset (reference) — as loaded, with missing
cells as
NaN. - cleaned_dataset (proposed) — rows with any missing
numeric feature dropped via
clean_dataset(), which reports the count removed. - normalized_dataset (variant) — the cleaned dataset
with numeric columns z-score standardized by
normalize_numeric()for cross-feature comparison.
The primary descriptive lens is the pairwise Pearson correlation among the numeric features.
6.3 Computational environment
- Language: Python (see root
pyproject.tomlfor the supported range). - Core dependencies:
numpy,pandas,matplotlib(declared indomain_profile.yaml::required_packages). - Headless plotting: the analysis script sets
MPLBACKEND=Aggbefore importing matplotlib.
6.4 Pipeline ordering
The typical analysis order is:
scripts/eda_analysis.py— loads and cleans the dataset, then writesfigures/*.pngandoutput/data/summary_statistics.csv, printing each output path for manifest collection.- PDF rendering reads
manuscript/*.mdandconfig.yamlso figure paths and prose match the analysis that just completed.
6.5 Relation to figures
| Figure (sec. 4) | Figure-data preparer
(src/template_eda_notebook/eda/figures.py) |
Primary inputs |
|---|---|---|
| Height histogram | histogram_data() |
height_cm column, 10 bins |
| Rows per group | group_count_data() |
group column |
| Correlation heatmap | correlation_heatmap_data() |
all numeric features |
This table is descriptive documentation only; it is not executed as code during the build.
7 Reproducibility
This section explains how to regenerate every artifact in the study from a clean checkout. The exemplar’s reproducibility guarantee is structural: each result is produced by a tested function and a thin script, never transcribed by hand.
7.1 How to regenerate everything
From the repository root:
# 1. Run the analysis (writes figures + summary CSV, prints output paths)
uv run python projects/templates/template_eda_notebook/scripts/eda_analysis.py

# 1b. Regenerate the deterministic dataset sibling (optional; stage 02 runs it too)
uv run python projects/templates/template_eda_notebook/scripts/generate_measurements_data.py

# 2. Run the test suite with the coverage gate
uv run pytest projects/templates/template_eda_notebook/tests \
    --cov=projects/templates/template_eda_notebook/src --cov-fail-under=90

# 3. Render the manuscript
uv run python scripts/pipeline/stage_03_render.py --project templates/template_eda_notebook
7.2 Generated artifact registry
The analysis scripts write the following artifacts under
projects/templates/template_eda_notebook/output/:
| Artifact | Produced by |
|---|---|
figures/height_histogram.png |
histogram_data() + analysis script |
figures/correlation_heatmap.png |
correlation_heatmap_data() + analysis script |
figures/group_counts.png |
group_count_data() + analysis script |
data/summary_statistics.csv |
summary_statistics() + analysis script |
data/measurements_generated.csv |
generate_measurements() + generator script |
The output/ tree is disposable and regenerated on every
run; it is not the source of truth.
7.3 Determinism
- The dataset (
data/measurements.csv) is a static, committed fixture with fixed content — the same file is read on every run, so every statistic is reproducible bit-for-bit. - The figure-data preparers are pure transforms with no RNG; the same inputs always produce the same bin counts, correlation values, and group counts.
clean_dataset()reports exactly how many rows it removed, so the complete-case row count is a checkable invariant.generate_measurements()(src/template_eda_notebook/eda/generate.py) regenerates a deterministic sibling of the dataset from a fixed NumPy seed: the same schema, 120 rows, the same missingness pattern, and the same correlation sign structure. The original fixture’s exact random draw order is not recoverable, so the generator deliberately reproduces the fixture’s documented contract rather than a byte-exact clone.
7.4 Verification (no hand-transcribed numbers)
Every quantitative claim in sec. 4 is
either reproduced by running the analysis script or registered in
data/claim_ledger.yaml for evidence-registry validation.
The manuscript intentionally does not embed volatile values, so prose
and artifacts cannot disagree. The notebook itself is verified
structurally by tests/test_notebook.py, which confirms it
is valid nbformat, that its from src imports resolve to the
library’s public surface, and that no cell defines its own logic.
8 Scope, Related Work, and Positioning
This section situates the exemplar and states explicit boundaries. The goal is not to compete with comprehensive treatments of exploratory data analysis (Tukey 1977) or statistical graphics (Wilkinson 2005), but to show how a minimal, test-backed EDA story fits the template’s reproducibility and rendering stack (Peng 2011).
8.1 Exploratory data analysis
The practice of examining a dataset before formal modelling — looking at distributions, missingness, and relationships — traces to Tukey’s foundational work (Tukey 1977) and is supported in modern practice by the pandas data analysis toolkit (McKinney 2010) and the broader scientific-Python stack (Harris et al. 2020). The present manuscript restricts attention to a first pass on a small tabular dataset: load, surface missingness, compute descriptive statistics and per-group means, and rank features by Pearson correlation.
8.2 Modelling and inference (out of scope)
What comes after a first EDA pass — hypothesis testing, regression, dimensionality reduction, or predictive modelling — is deliberately out of scope. The exemplar keeps the analysis minimal so the architectural lesson (notebook -> tested src extraction) stays visible rather than buried under statistical machinery.
8.3 What this project proves about the template
The analytical steps here are standard. The
non-standard contribution is procedural: the same
tested functions in src/template_eda_notebook/eda/ back the
interactive notebook, the headless analysis script, and this manuscript,
so the figures and the summary table always refer to the same code. That
pattern is what downstream projects should copy — whether the domain is
survey data, sensor logs, or experimental measurements.
8.4 Explicit limitations
- Dataset size: a single small synthetic cohort (120 rows) is used for transparent, fast reproduction; no large-scale or streaming data is handled.
- Cleaning policy: only listwise deletion is implemented; imputation is left as a documented extension.
- Correlation method: only Pearson correlation is computed; rank-based (Spearman) or non-linear association measures are out of scope.
- Statics only: the library returns plot-ready data; interactive widgets and dashboards are not part of the exemplar.
These limitations are intentional: they narrow the surface so that the reproducibility concerns — tested functions, a thin script, and a structurally verified notebook — remain visible rather than buried under analytical complexity.
9 References
Bibliography lives in manuscript/references.bib and is
read by Pandoc during PDF render. The build pipeline invokes Pandoc with
--natbib, so every [@key] citation in the
manuscript is rewritten to the appropriate
\cite{}/\citep{}/\citet{} LaTeX
command and resolved against the bib file.
To validate that references.bib is syntactically clean
and contains the required fields per entry type:
uv run python -m infrastructure.reference.citation.cli validate \
    projects/templates/template_eda_notebook/manuscript/references.bib --strict